
What reports can I find on the Digital Learning Hub?
In the Report section on the left-hand side there are three sets of reports:
- Your Report
- Organisation Data
- Snapshot Reports
Keep students motivated with ‘Your Report’
In the ‘Your Report’ section there are Student Reports available for students and organisations to view students’ progress so far.
Progress is presented in doughnut charts for Journey 2 English and Journey 2 Basic Skills to keep students motivated and so that they feel a sense of progress.
In addition, for Journey 2 Basic Skills, the reports can be broken down by CEFR level (A0, A1 and A2) to help beginners feel rewarded for their efforts.
This gives organisations visibility to celebrate successes, support and intervene if necessary.
Gain oversight with ‘Organisation Data’ report
The ‘Organisation Data’ report allows organisations to see how student’ activity and progress at a glance.
Track:
- How many students have logged in and their activity
- Students’ progress in % terms for each course and test individually, including the New User sign-up and English Skills tests
- How much time each student has spent on each course
Create and download snapshot reports
The snapshot report provides an overview of student progress for Journey 2 English and Journey 2 Basic Skills, along with full progress reports that can be downloaded, latest user activity and results of tests taken.
- The report can be viewed for the entire organisation, or it can be filtered by groups within the organisation.
- Tutors and moderators will receive weekly emails on a Friday from noreply@klik2learn.com to communicate that the weekly report has been generated.
Journey 2 English and Journey 2 Basic Skills course overview:
- This will graphically show students’ progress by week/month/overall, enabling tutors and moderators to compare students’ progress against the period before.
- It shows students’ progress in terms of time spent on the course and completion time:
- Learning time (the spent on the course so far)
- Not yet started.
- Completed less than 50%, or more than 49%.
- 100% completed
- Tutors and moderators will find this information for both courses, presented side by side, as shown below:
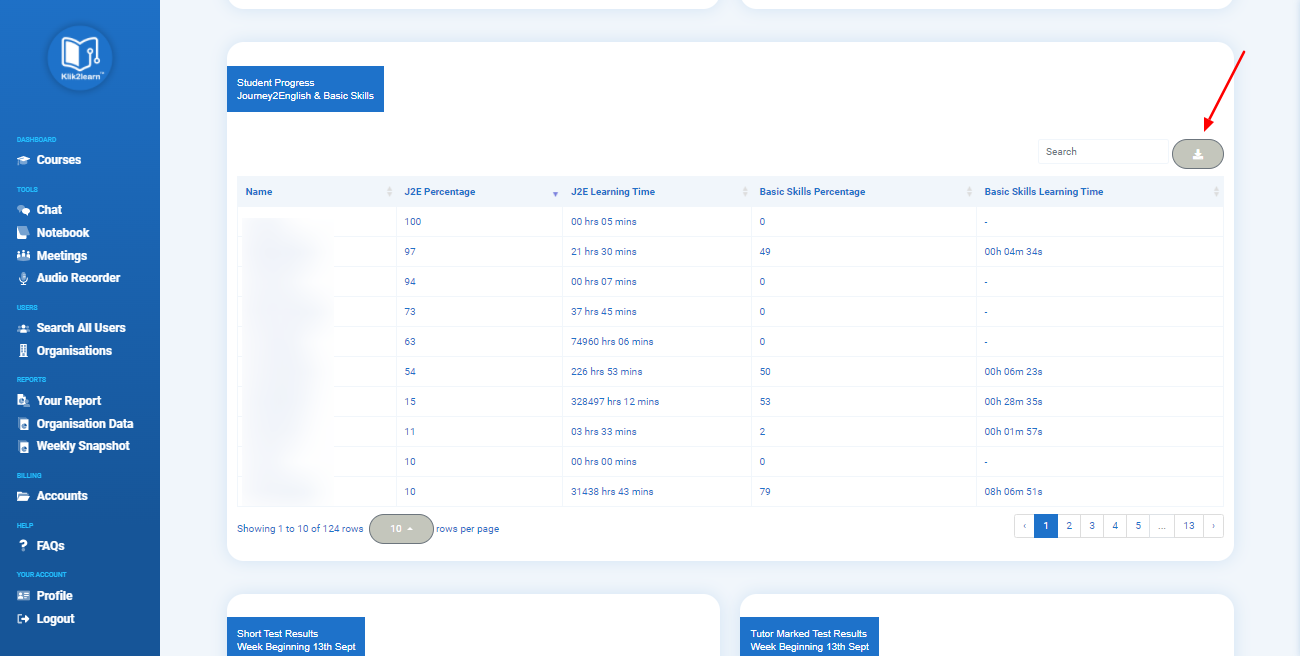
How to create a report
There are two drop-down options to change what is shown. The first one is for selecting which week to view and the second one is for filtering students by group.
There’s also a button to switch between Weekly and Monthly reports.
- This can be downloaded by clicking on the download icon highlighted above, the report will download as an excel file on your laptop/computer.
English skills Test results:
This will show a list of the students who have completed the New User sign-up, the Short or Full English Skills Test.
User Activity:
Tutors and moderators will be able to view the latest student activity, detailing users who have most recently been added to the organisation.